Pycon.de: python performance unleashed - Thomas Berger
(One of my summaries of the 2025 pycon.de conference in Darmstadt, DE).
The talk is about just the standard library: in how to use it better to speed up your python code. So not about different interpreters or about using external libraries.
Python is not known as a speedy language, but actually its speed is continuously going
up. 3.13 has twice the speed of 2.7, so the first tip is to simply upgrade your
python version.
No optimisation talk is complete without the Donald Knuth quote about “premature optimisation is the root of all evil”. Don’t spend all your time on worrying about efficiency in the wrong places or at the wrong time.
Where to optimise? Well, profile. %timit for quick micro-benchmarking (see the
docs), cprofile for function-level
profiling. Always measure before you optimise.
cprofile is a module in the standard
library, you use it like cProfile.run("your_function()"). You then get a list of all
the behind-the-scenes calls plus their duration.
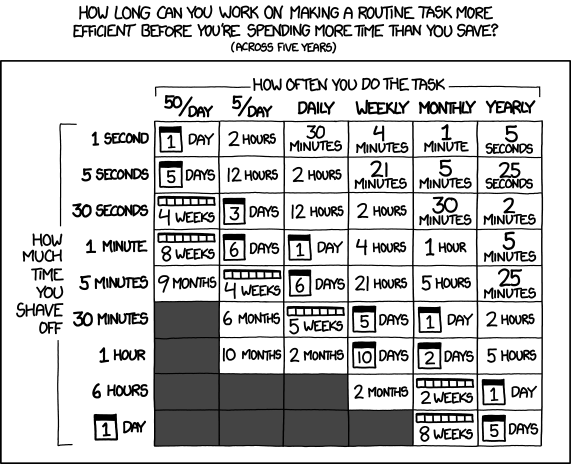
After profiling, you need to identify the actual problem. Is it a CPU problem? Or is it memory-related or an IO problem? Afterwards, you can optimise it. But always consider if it is actually worth optimising, see the XKCD comic.
Some tips:
Lookup membership in a list or a tuple: that doesn’t differ that much.
String concatenation is relatively expensive. A
.join()is often quicker.Look at the
map()andapply()functions.List comprehensions help a lot. But watch out when calling a function inside the list comprehension, that negates some of the speed improvements.
Use python’s cache.
from functools import lru_cacheand so.
Some pitfalls:
If you over-optimise, you can hurt readability/maintainability.
Concurrency issues. CPU concurrency or IO concurrency? If you optimise on both of them at the same time, you can get unwanted contention.
Watch out with the profiling results: only trust measurements that you also see in practice. A call that shows up in the profiler when calling it a million times is a worthwile target. But if that call is only called a few times in practice, it is not.
Best practices:
Profile before optimising.
Use well-tested libraries or built-in python funclions.
Aim at isolated improvements by adopting one technique at a time.
When you optimised something: document it for maintainability.

Photo explanation: picture from the recent “on traxs” model railway exhibition in Utrecht (NL)